
Analysis & Data Services
High Quality Data Analysis You Can Trust
We pride ourselves on delivering trustworthy, efficient, and premier data analysis services to our customers. Our dedicated team of experts ensures that every analysis project is accurate and reliable, providing deep insights that drive informed decision-making.
Utilising nCode Glyphworks 2024 And Other Tools to Efficiently Deliver Your Analysis Requirements
We provide the following services…
-
Design Verification
Dynamics – Ride & Handling
Failure Prediction
Post Sales Diagnostics
Powertrain Development
-
Model evaluation
Structural dynamics
Rig Replay
Accelerated life predictions
-
For rail and automotive Assess and determine the capabilities of your vehicle.
Accurate GPS and ground speed measurements
Event monitoring for precision measurements
Verify and assess to national and international standards
-
Determine the estimated life of a defective component or structure using fracture mechanics.
-
Electromagnetic Compatibility Testing
Safety and assurance.
-
Stress life and Strain life simulation
BS EN 7608 fatigue analysis
Equivalent damage prediction from cyclic loading
Equivalent load spectrum analysis
-
Raw data validation and provision
Digital Filtering - Band Stop, Band Pass, Low and High pass
Drift correction
Erroneous Data (Spike) removal
Statistics and analytics
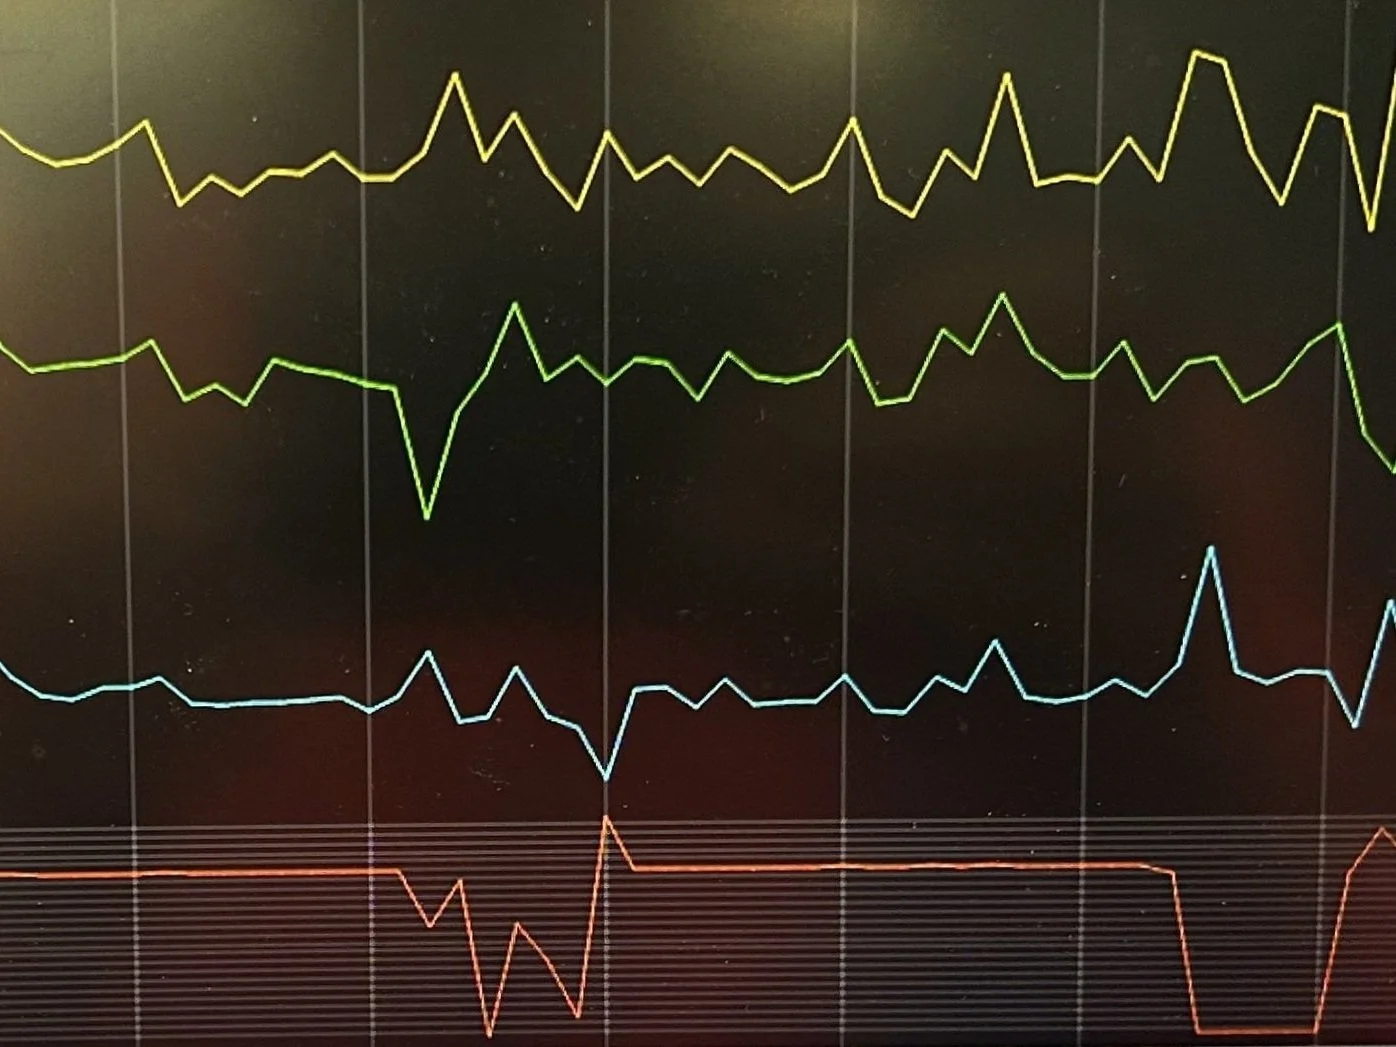
Our Broad Rail Specific Knowledge Base is Growing Year on Year
We provide the following services…
-
GMRT2141 - Permissible Track Forces and Resistance to Derailment and Roll-Over of Railway Vehicles
LOC PAS TSI 1302 - concerning a technical specification for interoperability relating to the 'rolling stock - locomotives and passenger rolling stock' subsystem of the rail system
BS EN 14363 Testing for the Acceptance of Running Characteristics of Railway Vehicles - Testing of Running behaviour and Stationary Tests
Vampire Dynamic Assessment / Validation
Complete product introduction and commissioning
-
BS EN ISO 50317 - Requirements for and validation of measurements of the the dynamic interaction between pantograph and overhead contact line.
BS EN 50367 - Railway applications. Fixed installations and rolling stock. Criteria to achieve technical compatibility between pantographs and overhead contact line
-
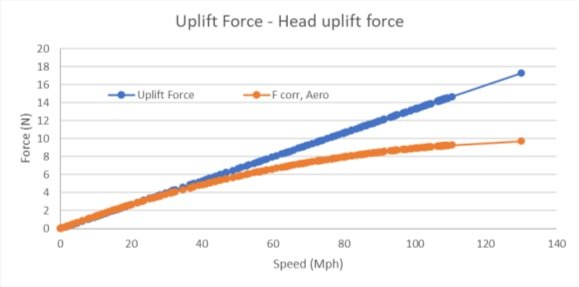
BS EN ISO 50317
Uplift force and Aerodynamic correction from cord force
Inertia calibration and correction
Contact force
Mean contact force
Statistical Max and Min
Position based data resampling
-
Taking real world, in service data and using it to predict the fatigue life of structure or vehicle such as rolling stock/rail.
Ultimately determining whether the structure is fit for continued service.
-
For Rail and road quickly determine the braking capabilities of your vehicle.
Accurate GPS and ground speed measurements
Event monitoring for precision distance measurements
Determine deceleration rates and verify against national and international standards
-
Electromagnetic Compatibility Testing
Safety and assurance.
-
BS EN ISO 3095 - Acoustics Railway Applications - Measurement of noise emitted from rail bound vehicles
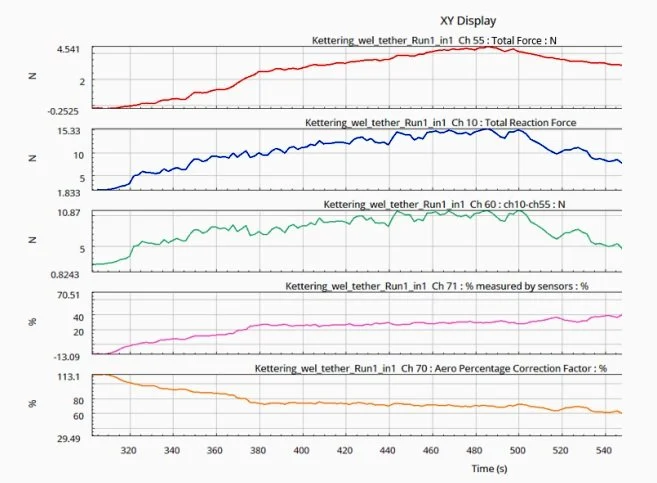
Other DATS Data Services
Modal Analysis
Assessment of a structures response, typically using accelerometers within the frequency domain.
Use of FEA to corelate the measured modal frequencies to the model.
Formal Reporting
EN and ISO standardised testing
Reporting to meet rail RFU-022 & GMRT standards
FFT and Frequency Domain Analysis
Time series data that is deconstructed using fast Fourier transform analysis (FFT) to identify dominant and or resonant frequencies.
Can also be used to remove/identify noise such as 50 Hz mains frequencies in a data set.
Data Handling and Cloud Computing
ISO 9001 management systems ensure your data is handled and stored efficiently by competent personnel.
Store and access any data we record for you via the cloud.
CAN Data / Digital Bus Correlation and Validation
Integrate your digital and analogue signals with ease
Long Term Data Storage
All our test data is stored securely for a minimum of 5 years but can be held longer on request.
Data is held in our on site data centre servers and on the cloud, protected by the latest in online protection.
Remote Monitoring
Long term condition monitoring in remote locations
We can monitor your test from anywhere whether in the UK or overseas
Stream data over 5G or WiFi
-
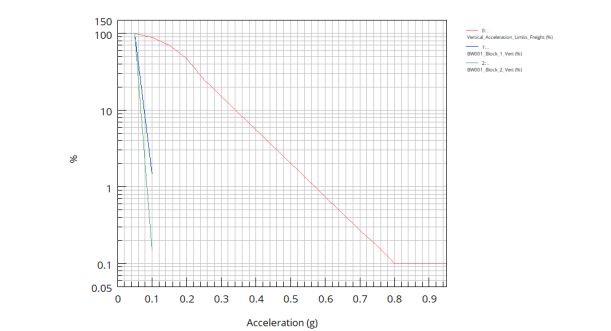
Dynamic Ride Evaluation GMRT2141
-
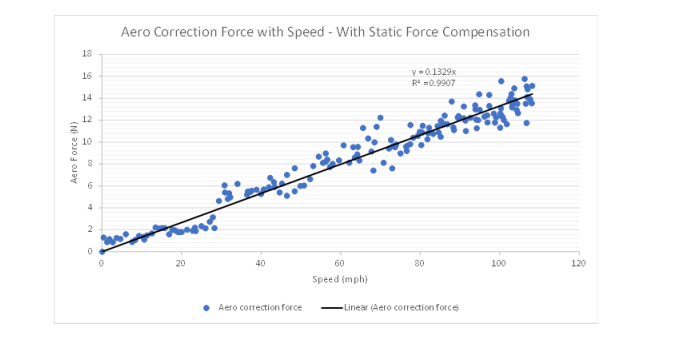
Pantograph & OLE Performance
-
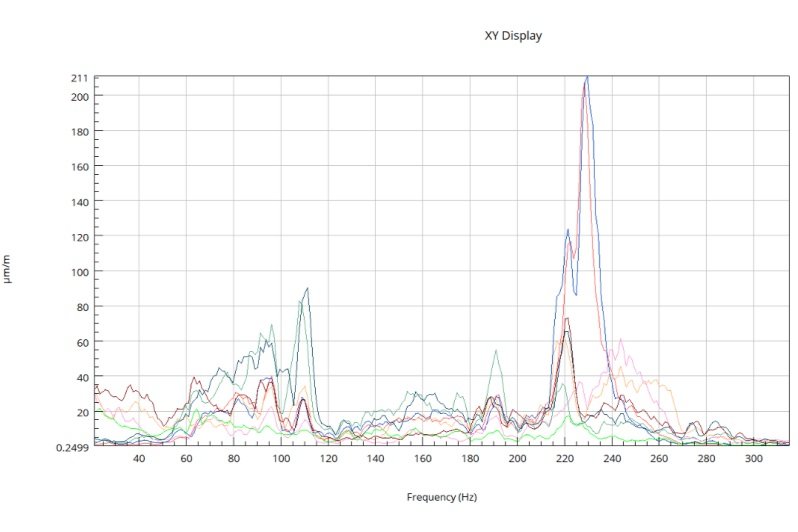
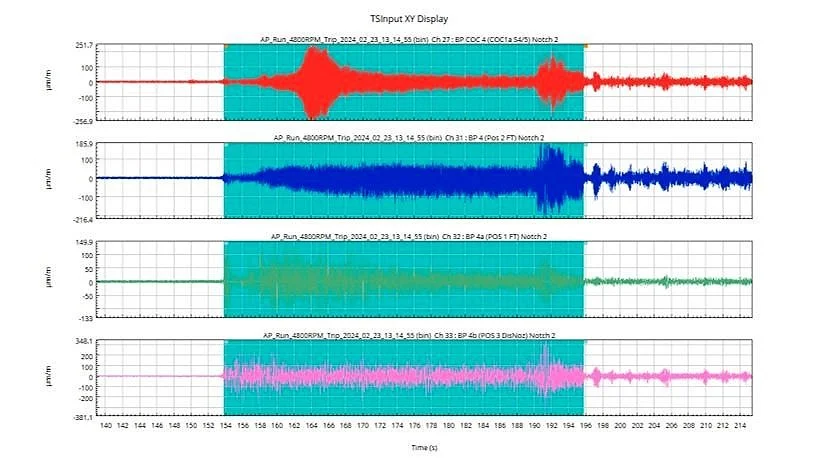
Frequency Domain Stress Testing
Book a free consultation
Step 1
Contact our Team
Click the button below to get in touch with our friendly team and tell us about your project.
Step 2
Discuss your Project
Our professional team will let you know how we can help you, and get a quote over to you as soon as possible.
Step 3
Getting started
Once we know that you are happy with your quote a member of our team will get you booked in.
Get in touch
Whatever the test, measurement or analysis project then DATS is the company for you! With our expert team of Engineers DATS is always on hand to help, with all the latest measurement technology and extensive experience. So why not click the button below and get in touch today. If you don’t see your services listed don’t panic! DATS may still be able to help you. A member of our friendly team will see how we can help.
